Stock Investing and Trading System
|
Top Stock Picks
 |
| |
Stock Market Chart |
|
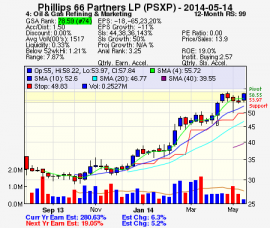
It has been said a picture is worth a thousand words. The same can be said for a stock market chart. A stock market chart provide you with a concise view of the trading history in a stock. For investors, longer time frames are most useful, e.g., a 1-year stock market chart or longer. Short term traders may find a daily stock market chart more useful. The stock market chart also provides you with a visual representation of where the stock price has been relative to previous periods. Is the stock closer to its 52-week high or 52-week low? Does the stock price show a recent uptrend or has the stock been basing for a while? Learning to read a stock market chart takes time and patience. Here at Growth Stock Analytics, we make extensive use of the stock market chart before any stock purchase is made. Let us help you improve your ability to read stock market charts. Growth Stock Analytics presents stock market investors entry to our proprietary stock grading system. Our HI-EPSRSTM Stock Database
is a one-stop source for stock market chart, and research/investing in high relative strength stocks:
- Get our Top Stock Picks.
- Perform Stock Screening.
- Inspect Stock Chart Blueprints.
- Look for Stock Breakouts.
- Confirm Fundamental and Technical Facts.
- Observe your Portfolio using Portfolio Notifications.
- Stock Market Chart, and more...
|
Testimonials"I like the service and am ready to sign up for a few more months whenever you want me to."...GLB, Oklahoma
|
|
Join now, for stock market chart. Remember, all the work has been done for you.
Become A Member - Join Now!
|
The Web Counter welcomes you as visitor  since June 15, 1996. since June 15, 1996.
|
| |


 Disclaimer The stock selections in our stock investing and stock trading database are not stock recommendations, but simply represent applications of a stock investing process. All materials, including our Top Stock Picks, are provided for information purposes only and should not be used or construed as an offer to sell, a solicitation of an offer to buy, or a recommendation for any security. Growth Stock Analytics, LLC is not responsible for gains/losses that may result in investing or trading in these securities. All information is believed to be obtained from reliable sources, but there is no guarantee that the information supplied is accurate, complete or timely. There is no guarantee or warranty with regard to the results obtained from its use. There is no guarantee of suitability or potential value of any particular investment or information source. You acknowledge that your requests for this information are unsolicited and shall neither constitute nor be considered investment advice. Past investing performance is not an indication of future performance results. Investing and trading in stocks is risky. Investors are encouraged to consult a registered stock broker or investment adviser before making any investing decisions. The interpretations and opinions expressed herein are solely those of Growth Stock Analytics, LLC, and not of any other individual or organization.