Stock Investing and Trading System Access the HI-EPSRS database See a six-month performance of our Top Picks Stick to a game plan Learn more about our service Answers to commonly asked questions |
Top Stock Picks Portfolio Comments2022-11-08: We have a signal to move out of **** and into ****. Current Stock Portfolio Positions: |
| |
Past Top Stock Pick Learn from these chart patterns. (Past performance does not guarantee future results)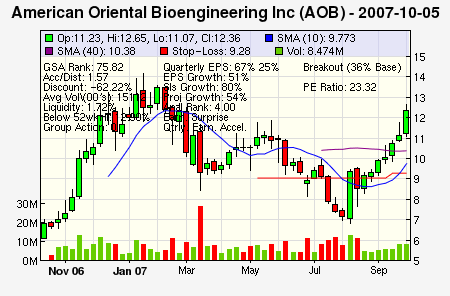
Up 0% from $12.36 (2007-10-08)
On October 8, 2007 we profiled American Oriental Bioengineering Inc (AOB) as a Top Stock Pick
to our members at $12.36. Within a period of six months, AOB did not meet our minimum profit objective of 15%. Obviously, we won't get every trade right, but here is what we had observed about AOB: - GSA Rank: 75.82 (Our proprietary ranking for AOB using fundamental AND technical factors)
- Accum/Dist Rank: 1.57 (Up vs. down volume action of AOB taken over several weeks)
- Discount : -62% (Our measure of AOB's valuation)
- Industry Group Rank: 4 (AOB was in an industry showing strong group action)
- Projected Growth Rate: 54.00% (AOB's projected 5-year growth rate)
Most importantly, AOB was trading just 12.9% off it's 52-week high price, and had a breakout from a sideways price consolidation pattern, a clear signal to time our position. It is imperative to not only buy the best stocks that are fundamentally sound, but also to time your purchase correctly.
| |


 Disclaimer The stock selections in our stock investing and stock trading database are not stock recommendations, but simply represent applications of a stock investing process. All materials, including our Top Stock Picks, are provided for information purposes only and should not be used or construed as an offer to sell, a solicitation of an offer to buy, or a recommendation for any security. Growth Stock Analytics, LLC is not responsible for gains/losses that may result in investing or trading in these securities. All information is believed to be obtained from reliable sources, but there is no guarantee that the information supplied is accurate, complete or timely. There is no guarantee or warranty with regard to the results obtained from its use. There is no guarantee of suitability or potential value of any particular investment or information source. You acknowledge that your requests for this information are unsolicited and shall neither constitute nor be considered investment advice. Past investing performance is not an indication of future performance results. Investing and trading in stocks is risky. Investors are encouraged to consult a registered stock broker or investment adviser before making any investing decisions. The interpretations and opinions expressed herein are solely those of Growth Stock Analytics, LLC, and not of any other individual or organization.